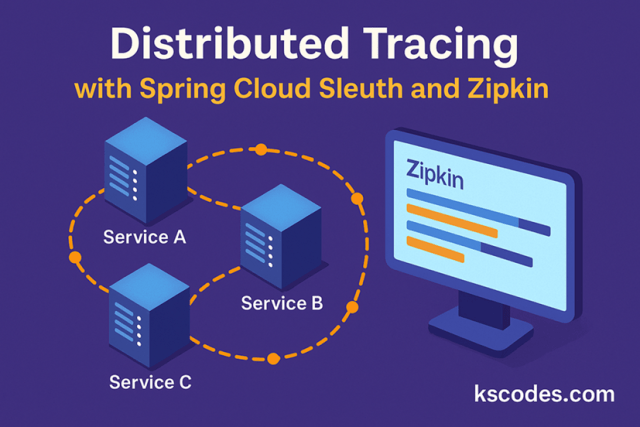
In microservices, requests often span across multiple services. When something goes wrong or performance degrades, it becomes challenging to trace the root cause. This is where distributed tracing shines.
This tutorial explains how to set up Spring Cloud Sleuth with Zipkin for full visibility into your service calls.
📖 Table of Contents
- What is Distributed Tracing?
- What is Spring Cloud Sleuth?
- What is Zipkin?
- Setup Project with Sleuth and Zipkin
- Configure Zipkin Server
- Sample Microservices Setup
- Trace IDs and Logs
- Visualize Traces in Zipkin
- Conclusion

🔍 1. What is Distributed Tracing?
Distributed Tracing helps you track a request as it flows through multiple services. Each trace consists of:
- Trace ID: Shared across the entire request.
- Span ID: Represents a single operation within the trace.
It helps:
- Identify latency bottlenecks
- Debug failures across services
- Provide end-to-end request visibility
🌩 2. What is Spring Cloud Sleuth?
Spring Cloud Sleuth automatically instruments your Spring Boot applications with:
- Unique
traceIdfor each request - Span IDs for each method call
- Integration with Zipkin for trace collection
📦 3. What is Zipkin?
Zipkin is a distributed tracing system that collects and visualizes traces.
- Collects spans and trace metadata
- Provides a UI to search and view traces
- Supports multiple storage backends (in-memory, MySQL, Elasticsearch, etc.)
⚙️ 4. Setup Spring Boot with Sleuth and Zipkin
✅ Dependencies (pom.xml)
|
1 2 3 4 5 6 7 8 9 10 11 12 |
<dependency> <groupId>org.springframework.cloud</groupId> <artifactId>spring-cloud-starter-sleuth</artifactId> </dependency> <dependency> <groupId>org.springframework.cloud</groupId> <artifactId>spring-cloud-starter-zipkin</artifactId> </dependency> |
Also, include Spring Boot Starter Web and Spring Cloud BOM:
|
1 2 3 4 5 6 7 8 9 10 11 12 13 14 |
<dependencyManagement> <dependencies> <dependency> <groupId>org.springframework.cloud</groupId> <artifactId>spring-cloud-dependencies</artifactId> <version>2023.0.0</version> <type>pom</type> <scope>import</scope> </dependency> </dependencies> </dependencyManagement> |
🛠 5. Configure Zipkin
✅ application.yml
|
1 2 3 4 5 6 7 8 9 10 11 12 13 14 |
spring: application: name: product-service zipkin: base-url: http://localhost:9411 sleuth: sampler: probability: 1.0 # Trace every request (100%) server: port: 8081 |
🧱 6. Sample Service Setup
✅ ProductService.java
|
1 2 3 4 5 6 7 8 9 10 11 12 13 14 |
package com.kscodes.springboot.microservice.service; import org.springframework.stereotype.Service; @Service public class ProductService { public String getProductDetails(String id) { return "Product details for ID: " + id; } } |
✅ ProductController.java
|
1 2 3 4 5 6 7 8 9 10 11 12 13 14 15 16 17 18 19 20 21 22 23 |
package com.kscodes.springboot.microservice.controller; import com.kscodes.springboot.microservice.service.ProductService; import org.springframework.web.bind.annotation.*; @RestController @RequestMapping("/api/products") public class ProductController { private final ProductService productService; public ProductController(ProductService productService) { this.productService = productService; } @GetMapping("/{id}") public String getProduct(@PathVariable String id) { return productService.getProductDetails(id); } } |
📥 7. Run Zipkin Server Locally
You can run Zipkin using Docker:
|
1 2 3 4 |
docker run -d -p 9411:9411 openzipkin/zipkin |
Then access the Zipkin UI at:
👉 http://localhost:9411
📄 8. Trace IDs and Logs
Spring Sleuth adds these to each log line:
|
1 2 3 4 |
[product-service, 8f7c9b1b35d0419f, 8f7c9b1b35d0419f.1, true] |
Where:
- First is the service name
- Second is
traceId - Third is
spanId - Fourth indicates whether it’s sampled
You can trace a request through:
- Logs
- Zipkin UI
🧪 9. Test Tracing Across Services
If you have two services (e.g., ProductService and InventoryService), calls between them will share the same traceId automatically when using RestTemplate, WebClient, or FeignClient.
Spring Cloud Sleuth auto-instruments the HTTP clients and passes the trace headers.
Example using RestTemplate:
|
1 2 3 4 5 6 7 8 9 |
@Autowired private RestTemplate restTemplate; public String callInventoryService(String productId) { return restTemplate.getForObject("http://localhost:8082/api/inventory/" + productId, String.class); } |
📊 10. View in Zipkin
Visit http://localhost:9411 and click “Find Traces”.
You’ll see the entire call path from:
- API Gateway → Product Service → Inventory Service
Each span shows:
- Duration
- Endpoint
- Service Name
- Timestamp
📌 Key Takeaways
- Spring Cloud Sleuth makes it easy to add tracing to Spring Boot.
- Zipkin helps visualize and analyze these traces.
- Trace IDs flow automatically across services.
- Logs and trace data are correlated for easier debugging.
✅ Conclusion
Spring Cloud Sleuth and Zipkin provide a powerful combination for distributed tracing in microservices. By visualizing the journey of a request, you can reduce MTTR, detect slow calls, and improve system observability.
Start tracing today to build more resilient and observable systems!